\(\)
Many complex graphs seem to contain some sort of community structure, representing a microscopic scale of organisation of the network. Nonetheless, many graphs do not seem to have any particular community structure, such as random graphs. One of the central questions then when finding a community structure in some empirical graph is whether it is very different from a random graph? In other words, is the community structure significant?
Most previously existing methods for assessing somehow the significance of a community structure (or individual communities), rely on randomising the network (either analytically or by simulation). By comparing some measure (e.g. number of links within community or internal degree) in the randomised network to the empirical network we are then able to infer its significance.
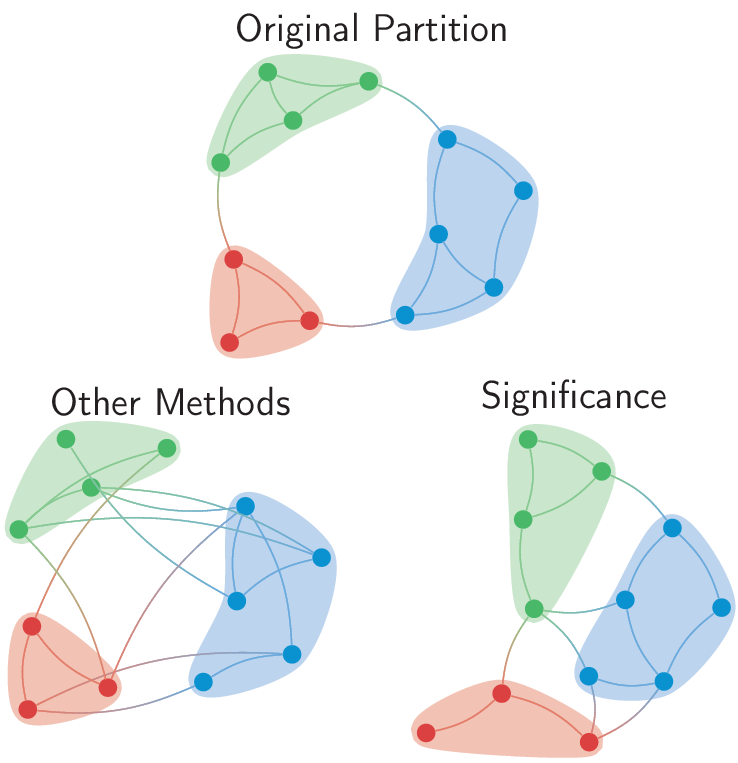
However, as I’ve recently argued, this foregoes an important aspect of finding a community structure in a network. After all, we look for the most salient partition in the empirical network. So shouldn’t we compare then our measures to the most salient partition in the randomised network?  Of course this could be done computationally, but we prefer to have an analytical answer. After all, having an analytical answer, allows you to immediately say if the community structure you found in your empirical graph is significant or not.
Although an exact expression of significance is hard to obtain, we are able to derive some interesting asymptotics. The central idea is that we look for the probability that the empirical structure can be found in a random graph. This leads to the question of how likely one of the observed communities can be found in a random graph. The asymptotic probability that a subgraph of size \(n_c\) and density \(p_c\) can be found in a random graph can be estimated to be
\[ \Pr \approx e^{-{n_c \choose 2} D(p_c \parallel p)} \]
where \(D(p_c \parallel p)\) is the binary Kullback-Leibler divergence.
Combining these individual probabilities we then arrive at the significance of a partition as a combination of the probabilities for all the communities to appear in a random graph, and taking (minus) the logarithm of that:
\[ \mathcal{S}(\sigma) = \sum_c {n_c \choose 2} D(p_c \parallel p) \]
Now this is all fine and well, but obviously, this measure will increase with graph size. So, unfortunately, we still have to know how this measure behaves in (random) graphs. In our publication we showed that for (Erdös-Rényi) random graphs this measure scales as \(n \log n\). In fact, in practice we used a scaled version of significance:
\[ \mathcal{S}(\sigma) = \sum_c n_c(n_c + 1) D(p_c \parallel p) \]
The scaling factor of \(2\) doesn’t have any importance in the asymptotics
anyway, and it had some other conveniences, but if you start comparing it to \(n \log n\), one does need to take this into account of course. One other thing is that this latter measure is somewhat more appropriate for directed graphs. All results in our publication, and also all results reported here are using this latter definition.
As I’ve said, we’ve showed that significance scales as \(n \log n\) for Erdös-Rényi (ER) random graphs. But one of the first questions that pop up is: shouldn’t we take the degree into account? As is well known, ER random graphs have a Poissonian degree distribution, which isn’t very realistic. Most empirical networks have more skewed degree distributions (known as “scale-free graphs”) So let us see significance results on graphs that have such a skewed degree distributions, in this case graphs generated by the Barabási-Albert (BA) model.

As you can see, significance for the BA model scales similarly as for the ER model. So, it seems that we can safely use \(n \log n\) also if we are dealing with a skewed degree distribution. It is not too difficult that \(n \log n/k\) is a lower bound for any graph, as long as they contain a perfect matching. After all, two nodes with a single link have a density of \(p_c = 1\), so that a division in \(n/2\) communities of \(2\) nodes a link between them—i.e. a perfect matching—the significance is \(\mathcal{S} = n \log n/k\). Even if a graph does not contain a perfect matching, but something close to it, this provides a reasonable estimate of a lower bound.
It has been argued that a community structure is also absent in some other type of graphs, such as very regular graphs like trees or lattices. We can of course also easily check this. After some thought it is quickly obvious that they will in fact behave quite different from random graphs.

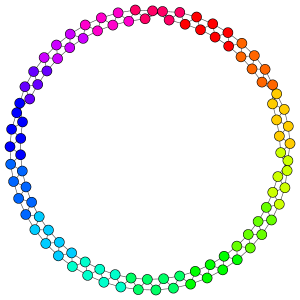
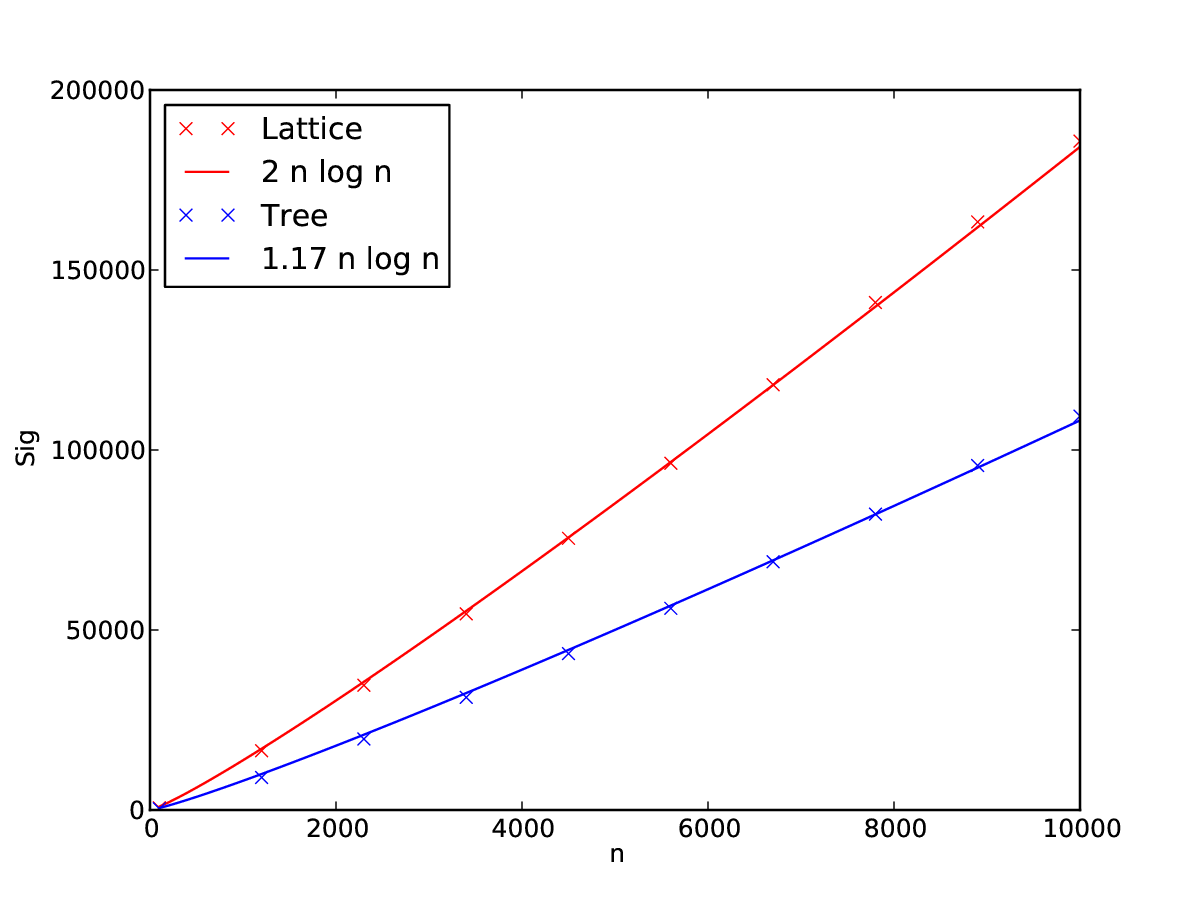
Let’s take for example a lattice. It will contain a lot of triangles, so quite a lot of subgraphs of size \(n_c = 3\) that have a density of \(p_c = 1\). Taking such a partition of triangles provides us with a lower bound on the significance, and we can easily calculate that it will scale as \((n_c-1) n \log (n/k) \) where \(k\) is the average degree. So, asymptotically, we expect significance still to behave as \(n \log n\) for a lattice but with a different multiplicative constant of \(n_c-1\) as for the ER and BA models.

Let’s see how this works for trees. Let’s say there will be about \(q = n/n_c\) communities of equal sizes \(n_c\). Since it’s a tree, each community will have \(n_c-1\) links, and so its density will be \(p_c = 2/n_c\). Working out the significance of this type of partition, we obtain \(\mathcal{S} \approx 2 \frac{n_c-1}{n_c} n \log (n/n_c) \). Assuming that \(n_c\) doesn’t grow with \(n\), we again have the same asymptotics of \(n \log n\), with a slightly different scaling factor.
Of course, these are only very rough back-of-the-coaster calculations (yes, I knowingly and willfully use “coaster” instead of “envelope”). So let’s see what simulations say, and if our coaster calculations hold to some extent. Indeed, as we can see in the figure below, the asymptotic scaling of \(n \log n\) does seem to hold for lattices and trees. The scaling factor of \(n_c-1\) for lattices is quite nicely reproduced if we assume that \(n_c = 3\), which makes sense, given that this lattice is generated with \(2\) neighbours on either side. The scaling factor for trees is a bit more off though, so our calculation seems to be a bit oversimplified. Nonetheless, for our coaster calculations, we seem to go in the right direction at least.

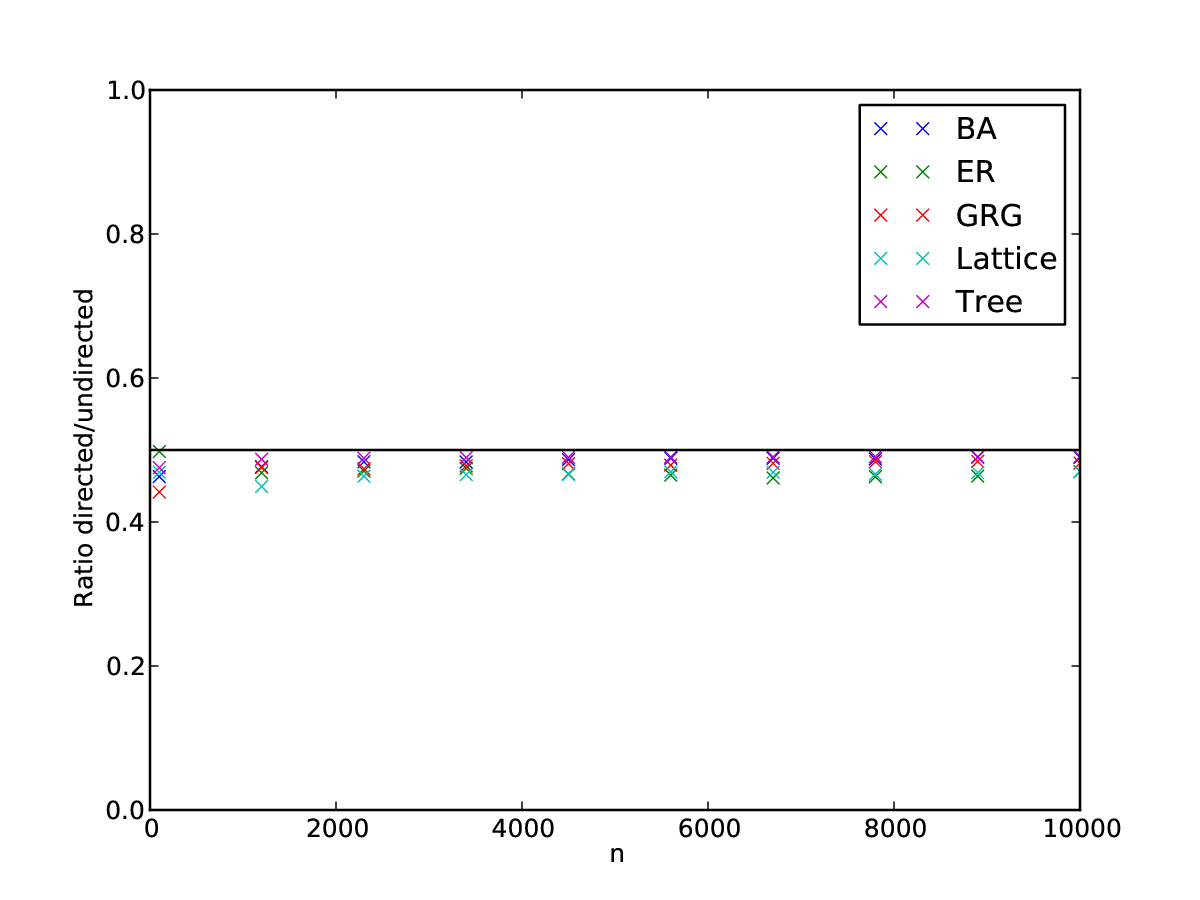
Until now, we have only dealt with undirected graphs. Can we say something how directed graphs are different from undirected graphs? Let’s again make some simple back-of-the-coaster estimates. Let’s take one of the undirected graphs considered before, and make it directed by randomly choosing one of the two directions for each edge (instead of both directions). Assuming the partition remains the same, we then know that \(\hat{p}_c = 1/2 p_c\) where \(\hat{p}_c\) is the density of the directed counterpart of the undirected version. For relatively high \(p_c\) and low \(p\), the Kullback-Leibler divergence also scales with a factor of about \(1/2\). So, we should expect that the significance also about \(\hat{\mathcal{S}} \approx 1/2 \mathcal{S}\) if we look at directed graphs instead of undirected graphs. Againg verifying our coaster calculations with some simulations, we observe that we are on the right track, and indeed, the scaling between the directed and undirected versions of the graphs for most types is about \(1/2\).

I have tried to give an impression here how significance behaves on a number of different types of graphs. For most of the types considered here, significance roughly scales as \(n \log n\), but with some different scaling factors. It would be interesting to make these observations more rigorous. Especially for ER and BA graphs (or other scale-free graphs), it would be interesting to have an exact calculation of the expected significance. Enough material for future papers left!
References